| Aruban | Cabo Verdean |
|---|---|
| Belizean | Aborigines |
| Bermudan | Cayman Islander |
| Brazilian | Comorian |
| Caribbean | Mauritanian |
| Creole | Aryan |
| Guyanese | Indian |
| Guyanese Indian | Indigenous |
| North American | Turkic |
| Surinamese | Ameriasian |
| Hispanic origins such as Mexican, Cuban, Puerto Rican | Eurasian |
| Other Caribbean or South American Responses, n.e.c. | Multiracial/Multiethnic/Biracial/Interacial/Multicultural |
New York City’s Burgeoning Multiracial Population and Its Impact on the Tabulation of Other Race Groups
December 2023
Key Takeaways
The 2020 Census showed that the multiracial population had doubled over the decade to nearly 300,000, partly an artifact of revisions to the 2020 Census questionnaire, but also due to real demographic shifts in the population.
The increase in the multiracial population had a major impact on the tabulation of major race groups. The Black population decreased by 84,400 between 2010 and 2020 and the White population fell by 3,000, but there was substantial growth among other racial/Hispanic groups.
A segment of the increase in the multiracial population was an artifact of a change in the census questionnaire, which affected Black as well as White respondents who may have been counted as a single race in the previous decade but were identified as multiracial in 2020. This misclassification could have accounted for as much as one-half of the decline in the Black population.
Most of the increase in the overall multiracial population, however, reflected a real demographic shift in the number of respondents identifying as being of two or more races. The multiracial population identifying as both Black and White more than doubled in size, from 22,900 in 2010 to 46,800 in 2020, and the multiracial population identifying as White and Asian increased nearly two-fold to 76,900.
When the increase in the overall multiracial population—Black in combination with other races and White in combination with other races—is considered, the 84,400 decline in the Black population is attenuated to a decrease of just 9,300, while the decline of 3,000 in the White single-race population reverses direction to an increase of over 100,000.
1 Introduction
The decline of the Black and White populations1 in New York City attracted media attention2 following the release of the 2020 Census, with some reports suggesting that these groups were increasingly deciding to settle outside of NYC due to myriad push and pull factors. The city’s 5 percent decline in the Black population and the 0.05 percent decline in the White population between 2010 and 2020 stand in stark contrast to the large increase in other ethno-racial groups in the city. The Asian and Hispanic populations, for example, surged during this period aided by international migration from Asia and Latin America. While demographic forces, including declining fertility within the Black population and large outflows from the city, may be partly responsible for the drop in the Black and White populations, these declines also need to be viewed in the context of revisions to the 2020 Census questionnaire and alongside real demographic shifts in self-identification, which taken together have resulted in a doubling of the multiracial population.
Unlike previous censuses, Black as well as White respondents in the 2020 Census were allowed to identify both their race and origin, which resulted in unanticipated and, perhaps, unintended ways for respondents to be classified as multiracial when their race and origin were coded into separate categories. Thus, some Black or White respondents who may have been counted as a single race in the previous decade were identified as multiracial in 2020. While these changes to collection and processing of race responses were partly responsible for the multiracial population increase, a real and substantial demographic shift also occurred last decade, which was accurately reflected in the growth in the multiracial population.
This monograph contextualizes declines in the city’s Black and White populations in light of both the revisions to the 2020 questionnaire and changes in how New Yorkers self-identify. The latter is not about understanding multiracial identity, but to showcase how growth in multiple-race responses, which along with questionnaire changes, have contributed to a decline in Black and White single-race counts. For broader context, this monograph starts with how Hispanic groups and single-race groups are defined in the decennial census, before moving on to a review of how multiracial groups are classified. It then examines the impact of the increase in the multiracial population on the counts of the single-race Black and White populations.
2 Defining and Classifying Race and Hispanic Origin in the Census
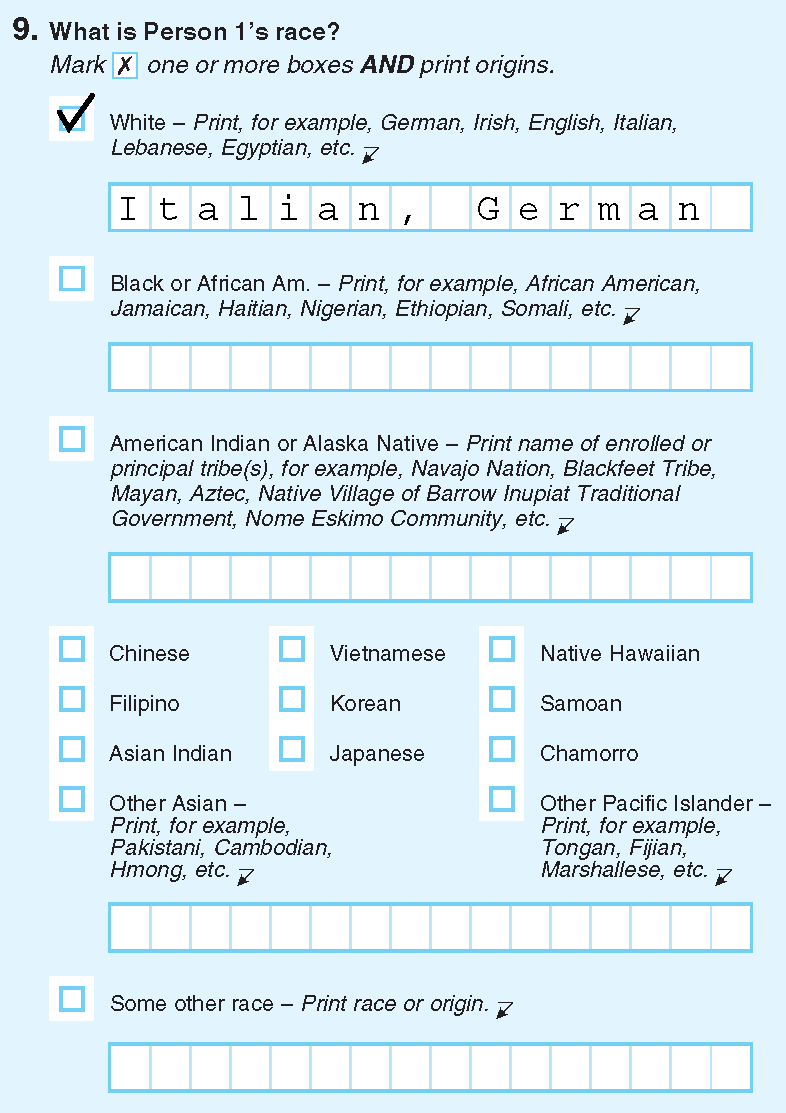
The U.S. Office of Management and Budget (OMB) sets the standards for the collection and tabulation of race and ethnicity responses on the decennial census, which are garnered from a two-question format (Figure 1).3, 4 This section offers an overview of how OMB’s definitions of Hispanic origin and race were captured on the 2020 Census questionnaire.
2.1 Hispanic Origin
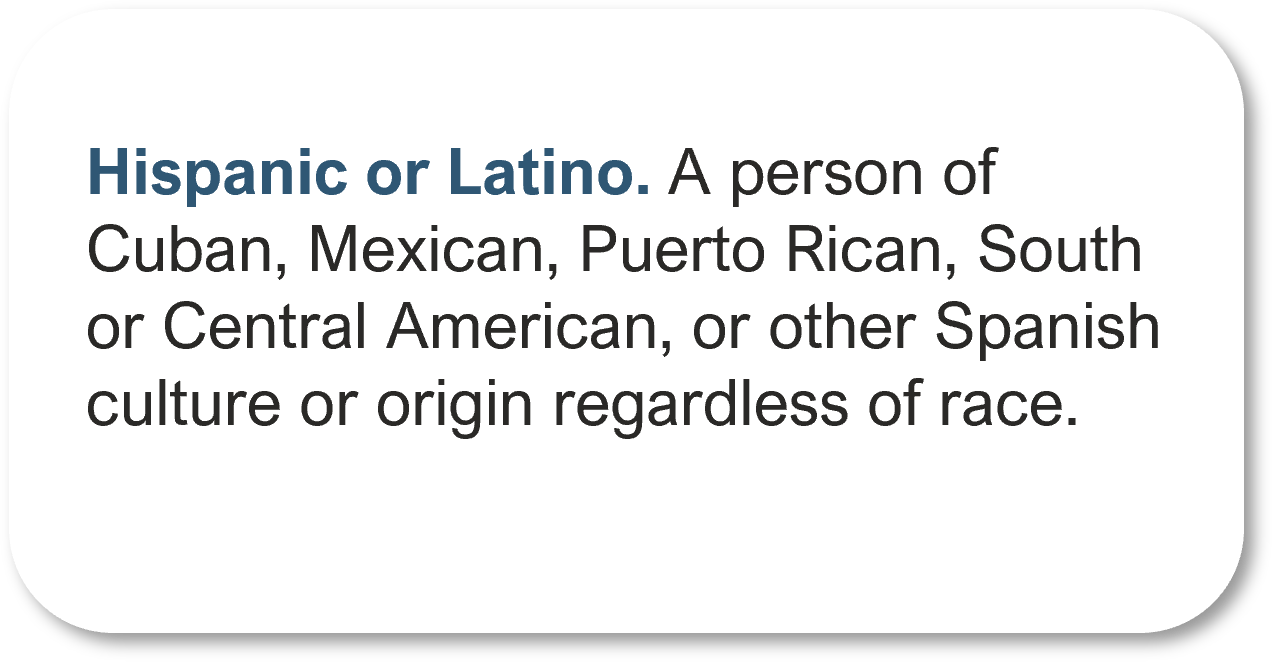
OMB defines Hispanic/Latino origin as “a person of Cuban, Mexican, Puerto Rican, South or Central American, or other Spanish culture or origin regardless of race” (Figure 2). This definition encompasses people who are from Spain or any Spanish-speaking country in Central America, South America, and the Caribbean.5
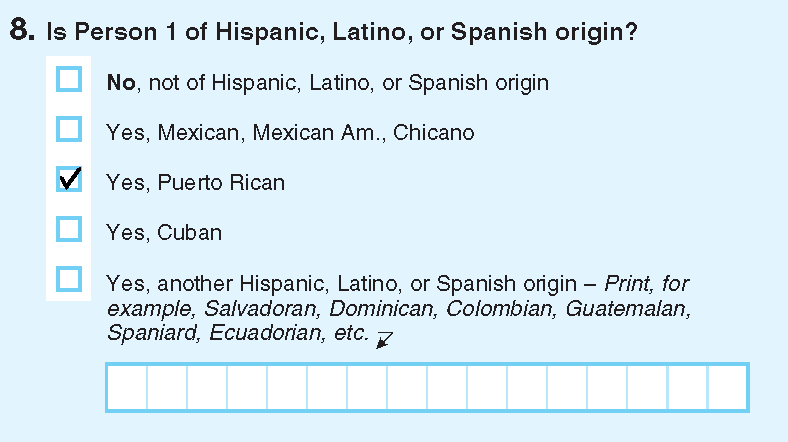
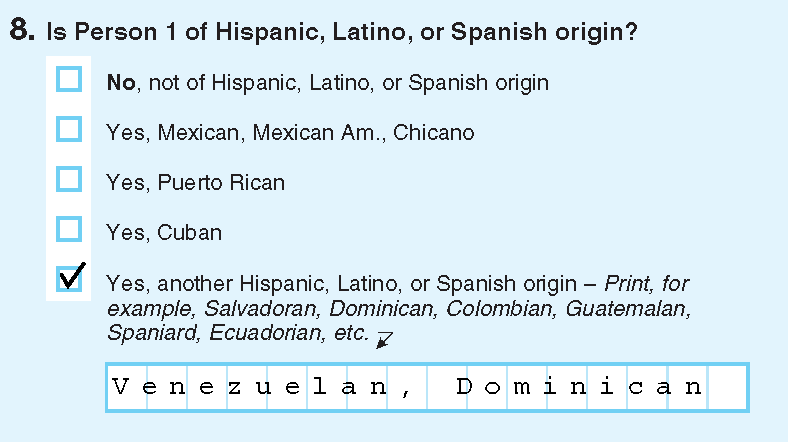
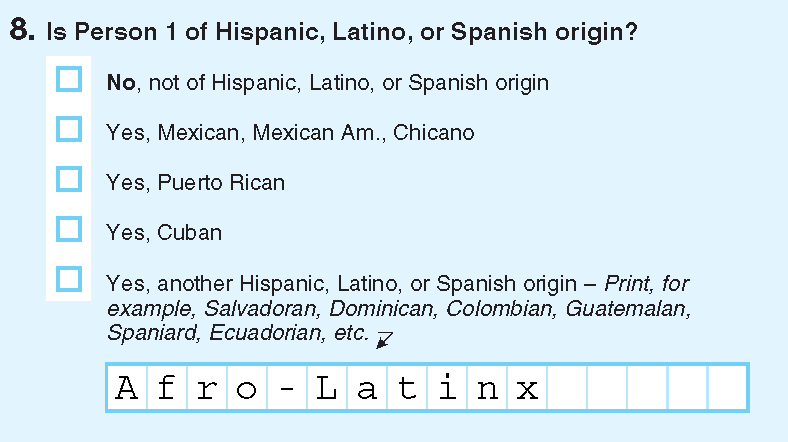
To inform respondents that Hispanic ethnicity and race are separate concepts on the census, an instructional note prefaces the ethnicity and race questions (Figure 3). Hispanic ethnicity was determined using question 8 (Figure 4). Respondents were tabulated as Hispanic if they marked a checkbox next to a “yes” category (Figure 4 (a)) or wrote in a valid response in the write-in area of the “Yes, another Hispanic, Latino, or Spanish origin” category (Figure 4 (b), Figure 4 (c)).

A mutually exclusive race/Hispanic origin category can be constructed using a combination of question 8 on Hispanic origin and question 9 on race (Figure 1). In this schema, respondents who responded “yes” to any category on question 8 were categorized as Hispanic, irrespective of what they answered on the race question that followed. Those who checked the response, “No, not of Hispanic, Latino, or Spanish origin” were considered non-Hispanic. In this document only race responses of non-Hispanic respondents are examined.
2.2 How OMB Defines Race
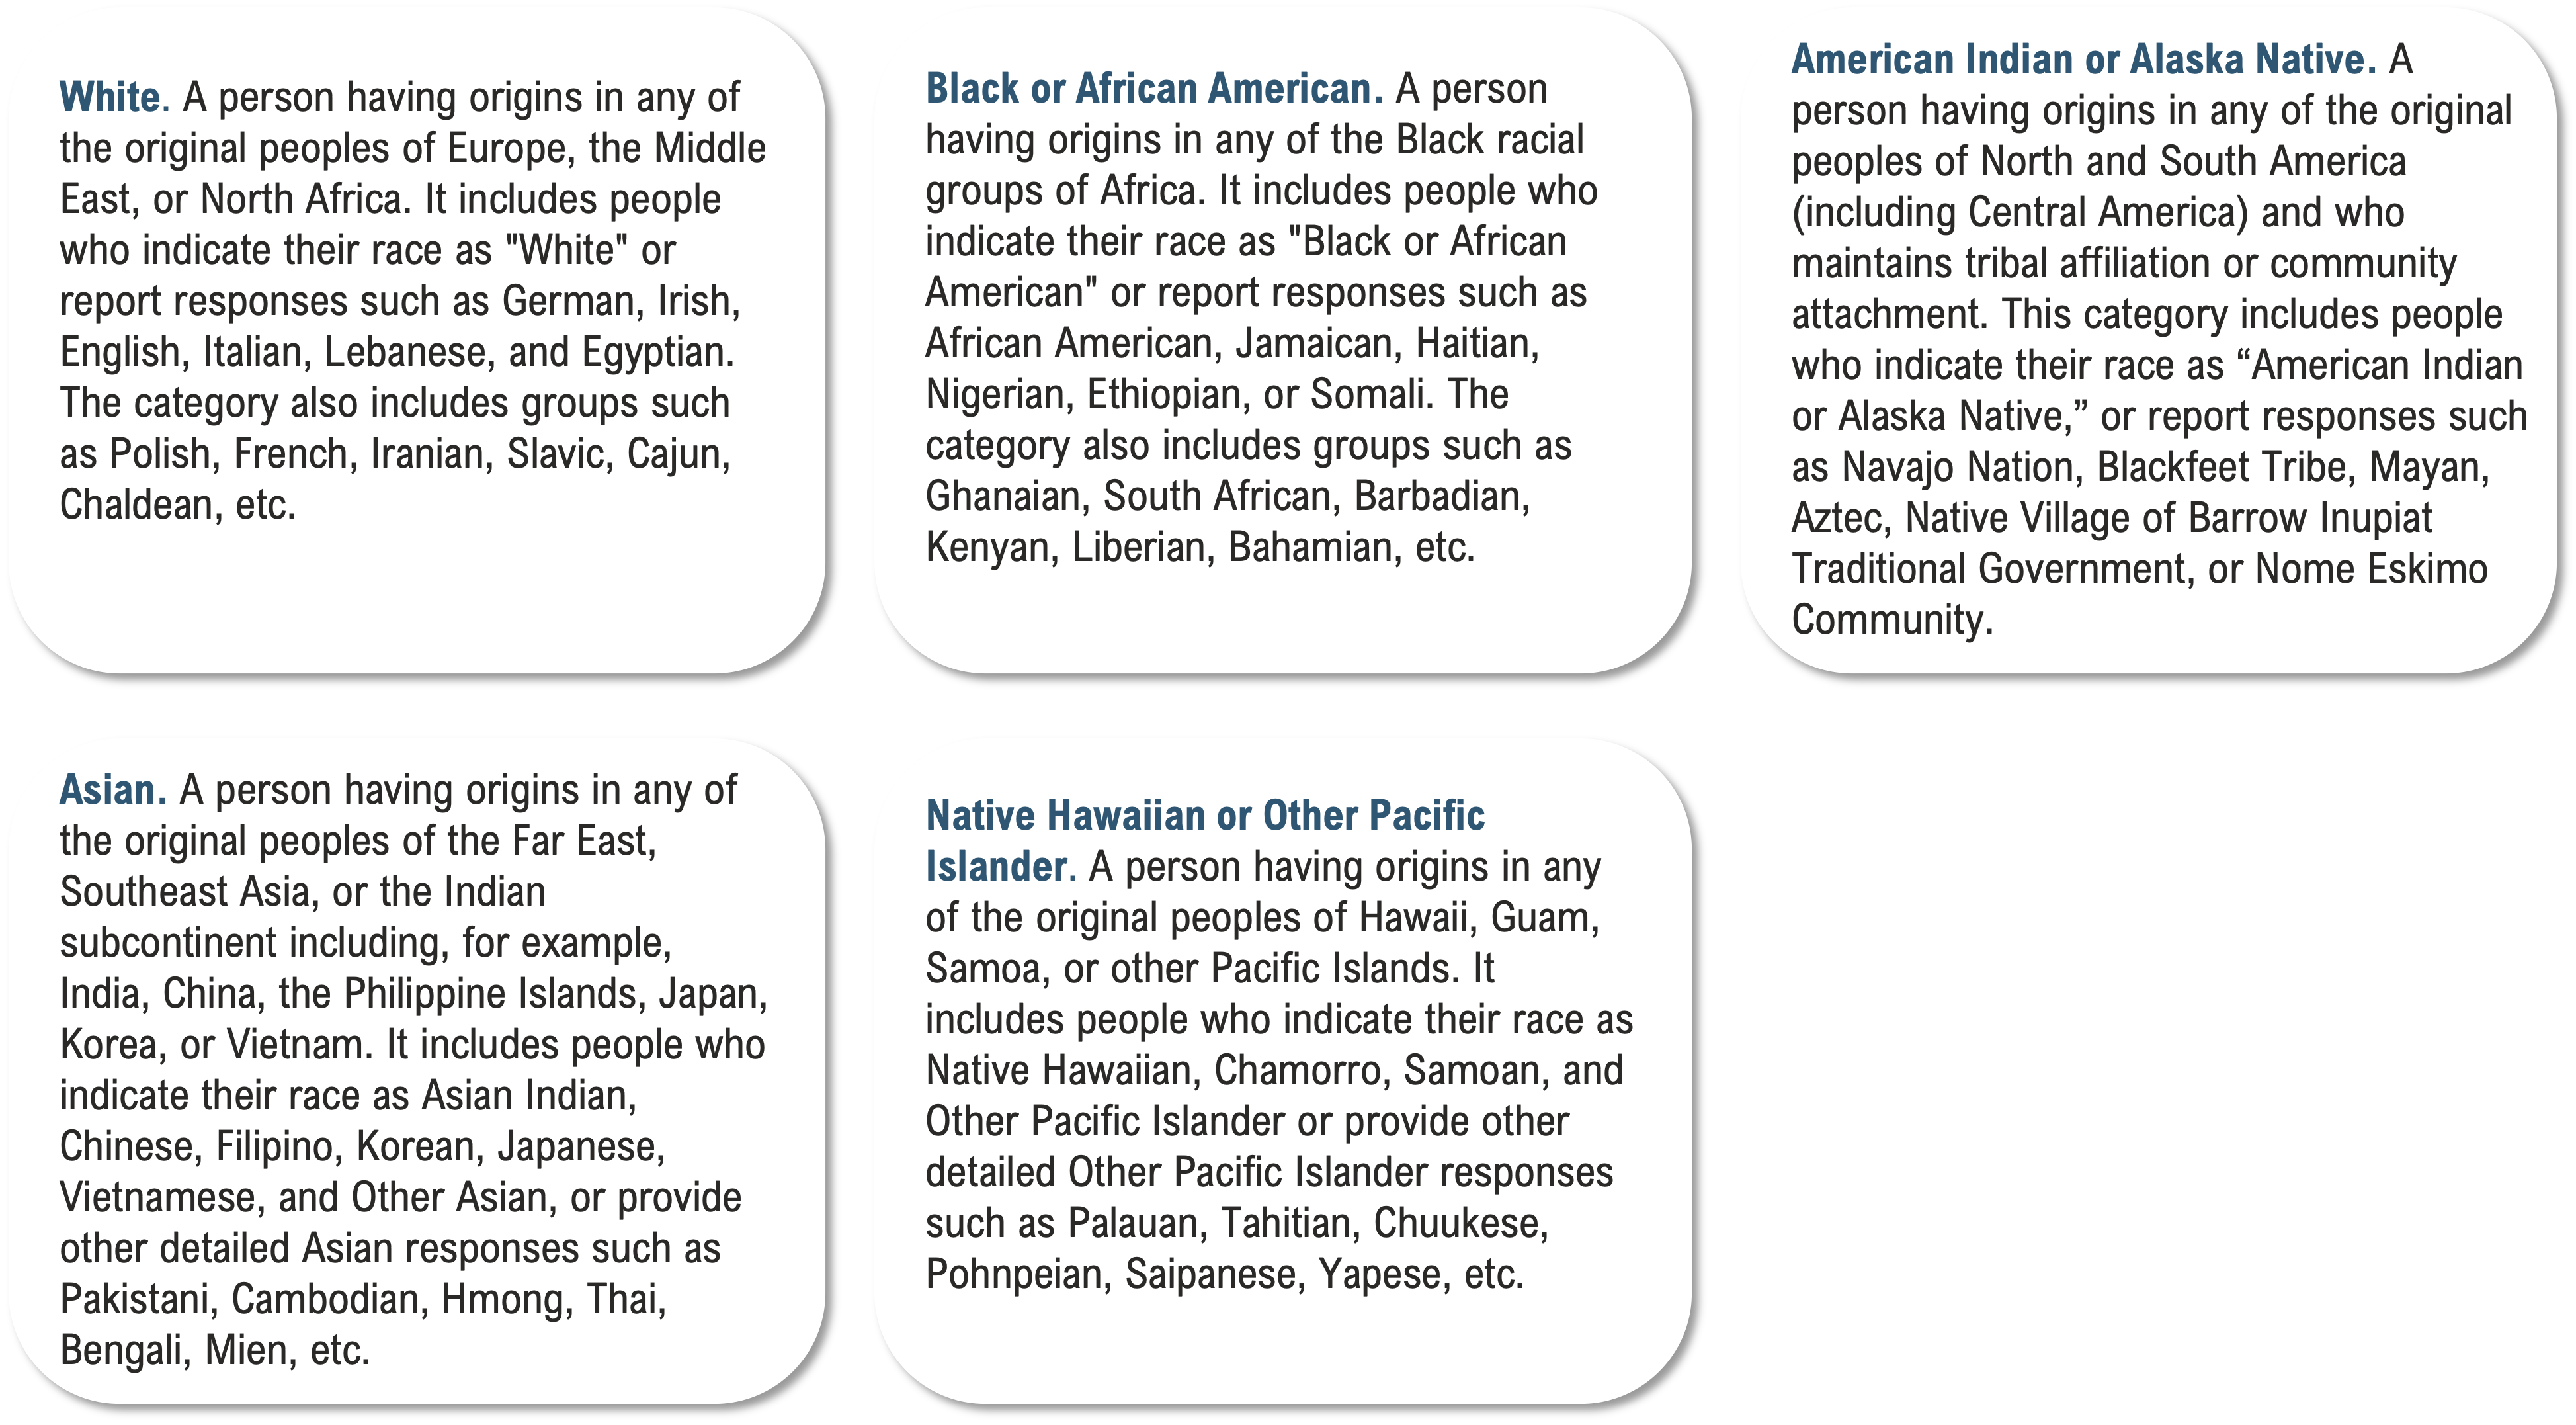
OMB delineates race groups by geographic origin. More specifically, race groups have “origins in any of the original peoples” of specified regions.6 The five race groups delineated include Native Hawaiian or Other Pacific Islander (having origins in the Pacific Islands), American Indian or Alaska Native (the continents of North and South America), Asian (Asia), Black (Black racial groups of Africa), and White (Europe, Middle East, and North Africa) (Figure 5). The Census Bureau further notes that these standards “generally reflect a social definition of race recognized in this country and not an attempt to define race biologically, anthropologically, or genetically.” 7
Definitions of 2020 Census Race Groups
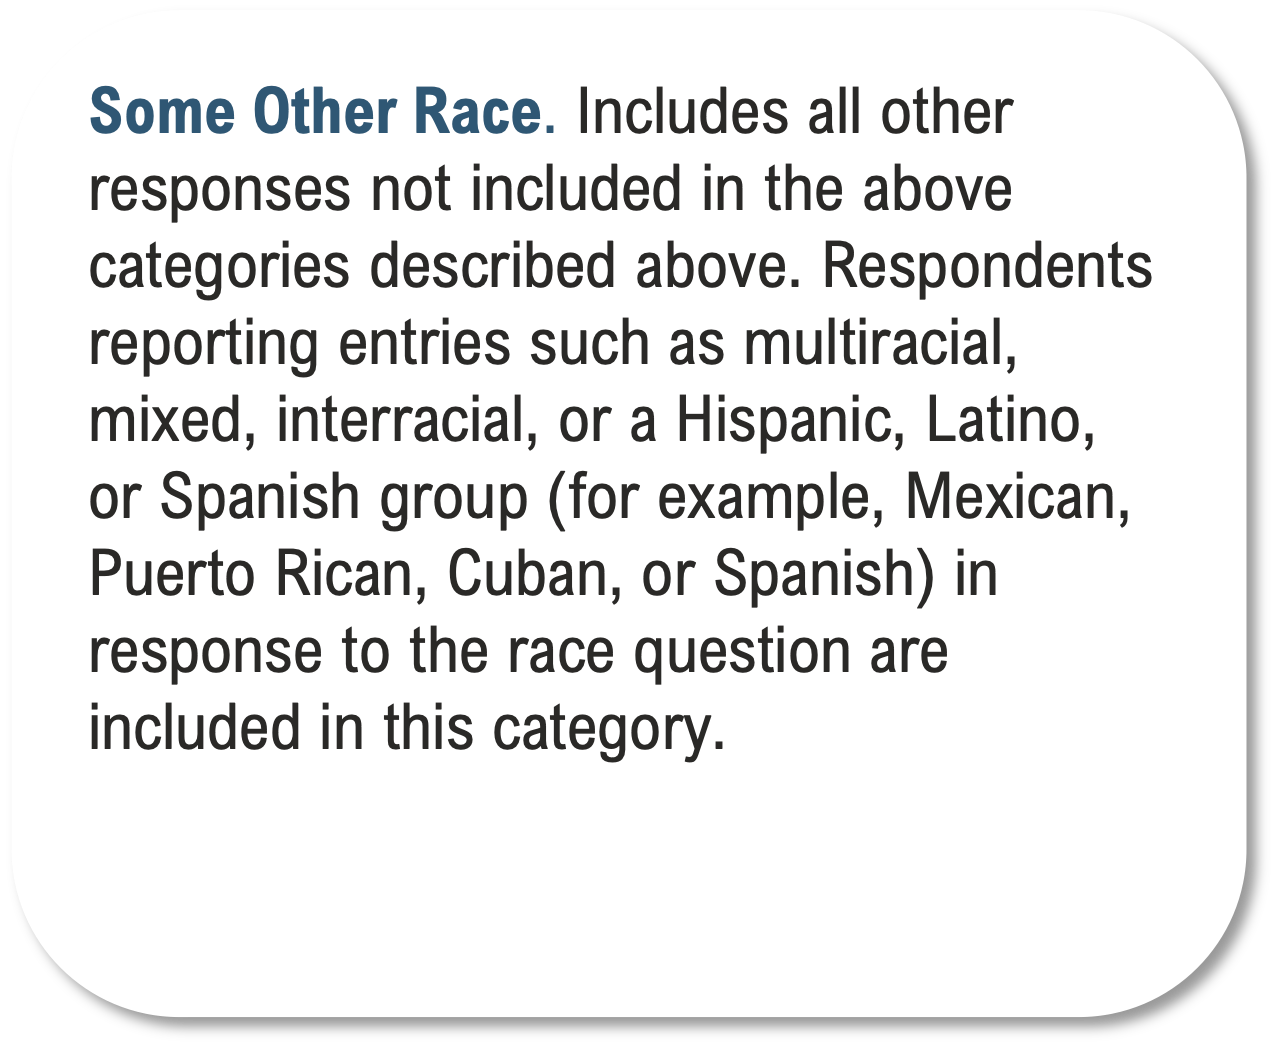
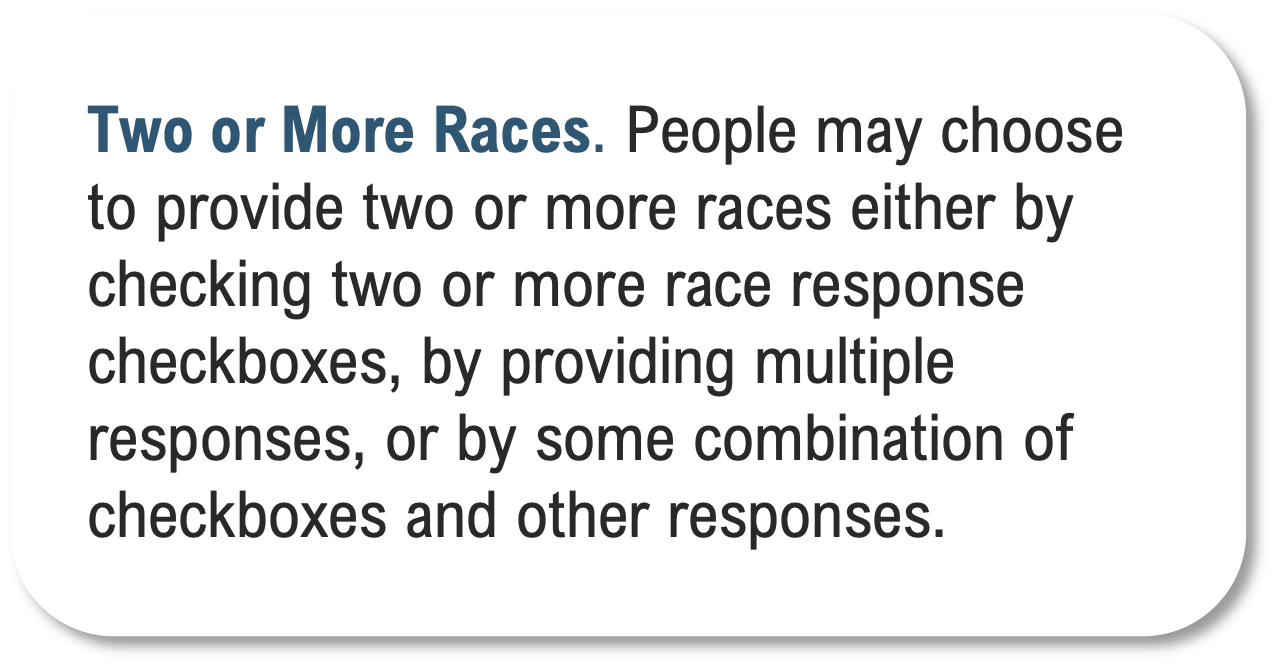
While OMB considers these race categories to be “comprehensive in coverage,” it permits a sixth Some Other Race (SOR) category for respondents who do not identify with the five race groups (Figure 6). Prior to the 2010 Census, however, the burgeoning SOR category was at risk of being eliminated by the Census Bureau. Given concerns that forcing respondents to identify racially with OMB’s categories would undermine the quality of the data,8 the Census Bureau retained the SOR category on the census questionnaire.9 Respondents can also identify with multiple groups (Figure 7).
The 2020 race question instructed all respondents to “Mark one or more boxes AND print origins (Figure 1 (b)). Respondents were given the option to select White, Black, American Indian or Alaska Native, detailed Asian subgroups, detailed Native Hawaiian-Pacific Islander subgroup, and SOR. For the first time in 2020, Black and White respondents could report their origins alongside their race. It is important to keep in mind, however, that OMB’s definitions specify which origins conform to each racial category. The significance of category definitions is explored when we discuss how respondents are classified as multiracial in Section 2.4.
To guide respondents, the Census Bureau gives example groups that fall under each racial category. But, like the Hispanic ethnicity question, the examples given are not exhaustive. Figure 8, Figure 9, and Figure 10 present the different ways responses are tabulated to three of OMB’s major race groups.
Race Coding Scenarios

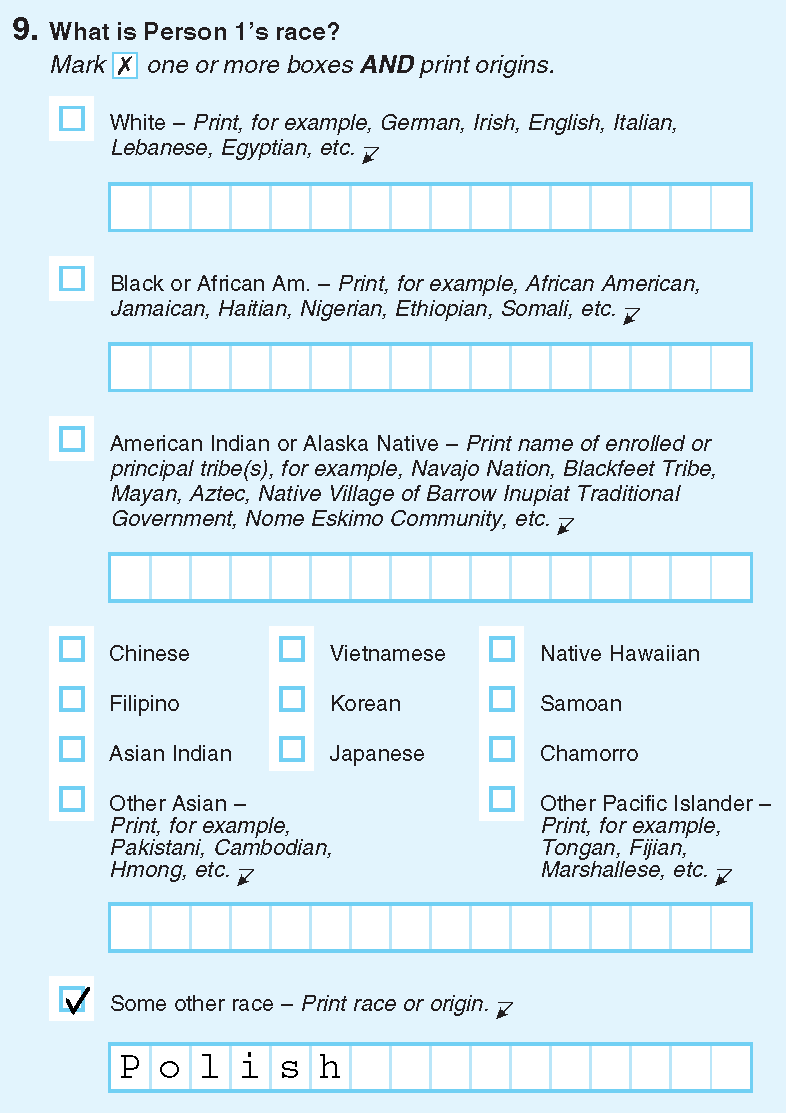
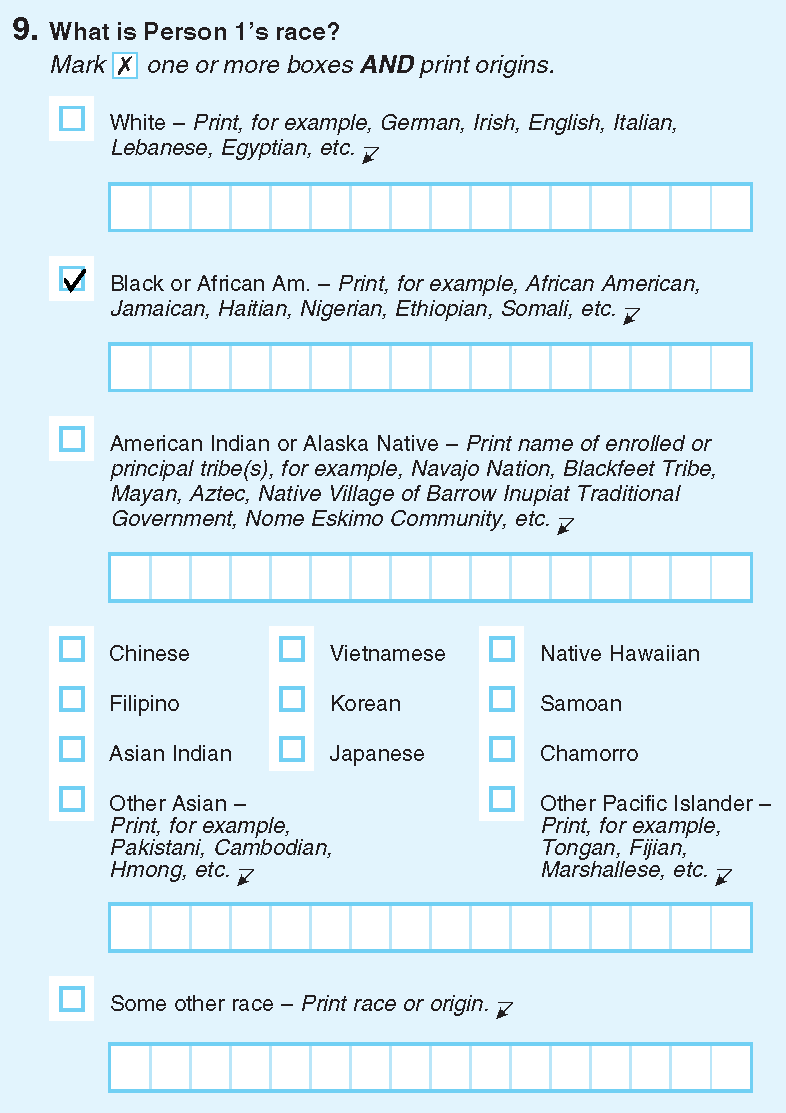

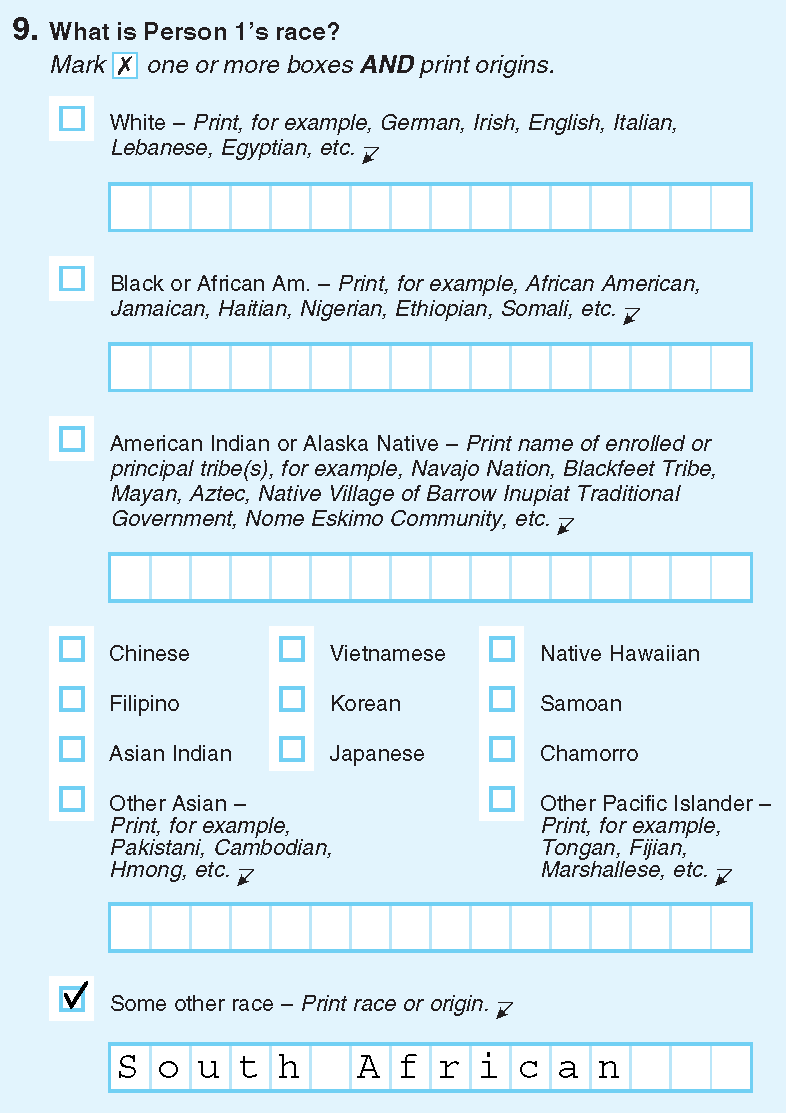


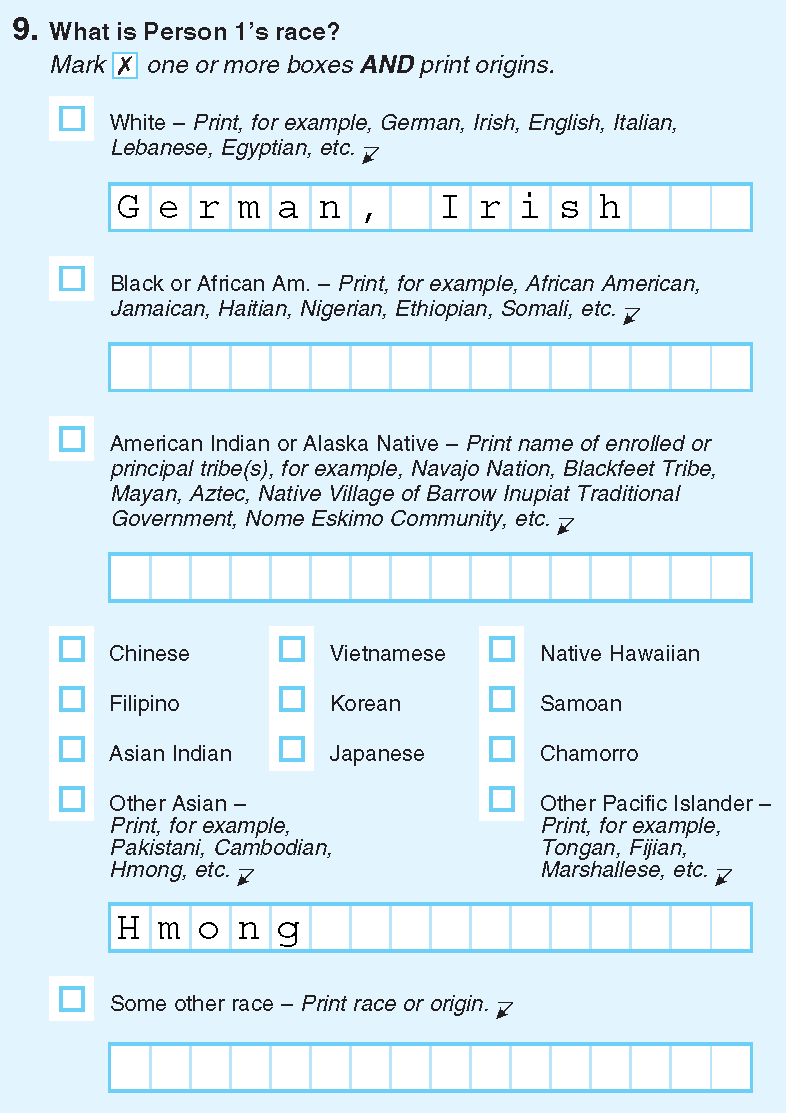
The Census Bureau tabulates race responses using a combination of marked checkboxes and write-in responses. Marked boxes without write-in responses are autocoded to that category. For instance, respondents who marked White (Figure 8 (a)), Black (Figure 9 (a)), or Asian (Figure 10 (a)) checkboxes without writing in an origin were tabulated as those groups.
Write-in responses are independently coded and then assigned to a race category regardless of where they were written in the race question. This means that to comply with OMB’s racial guidelines, some responses in the Census Bureau’s final tabulation may differ from how respondents self-identified on the questionnaire. For example, when origins do not meet the definition of a category—as in the case of Polish, South African, and Taiwanese written under the SOR category in the examples in Figure 8 (c), Figure 9 (c), and Figure 10 (c) —they are reclassified to an OMB race category. Regardless of how write-in responses are classified or reclassified, checkboxes are always honored, meaning that reclassified write-in responses could possibly lead to unintended tabulations as two or more races (Section 2.4).
2.3 Some Other Race
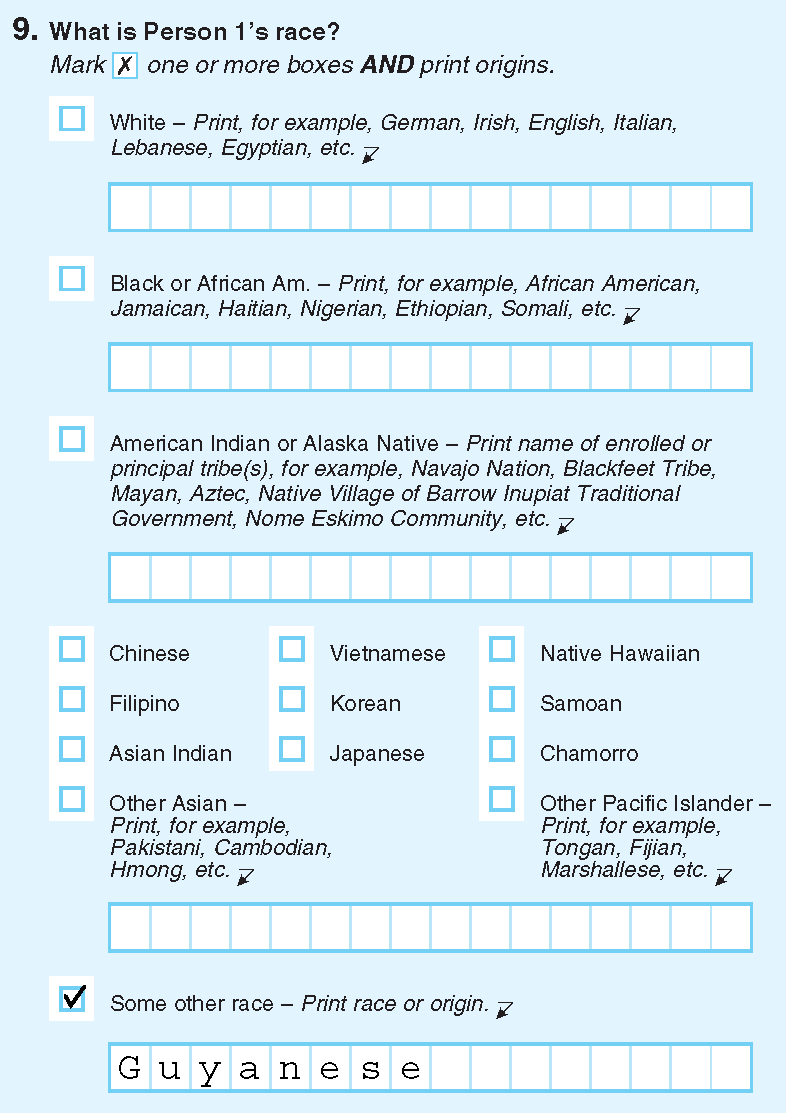
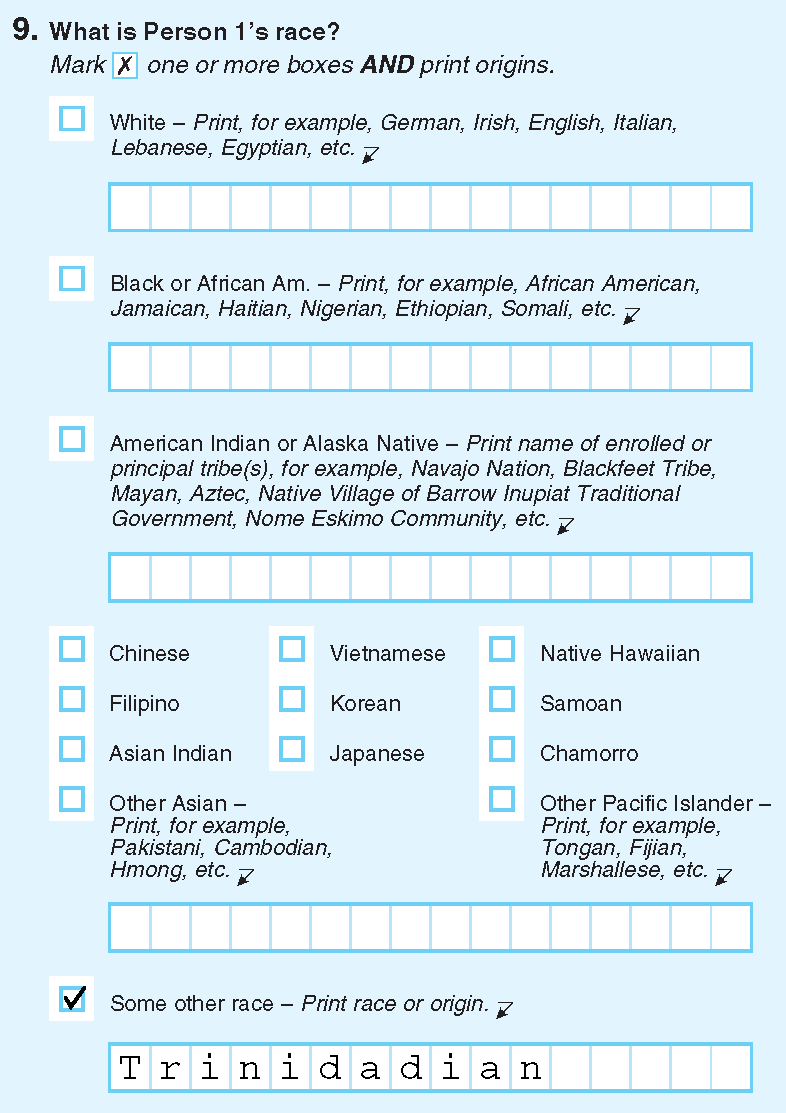
Respondents are classified as SOR alone if they check the SOR category without providing a write-in response (Figure 11 (a)) or mark the box and enter any of the groups found in Table 1. Intended as a residual category, SOR captures a diverse set of identities. It includes nationalities without a dominant racial group (e.g., Guyanese or Brazilian) and ambiguous terms that can apply to multiple groups (e.g., Indian, “mixed,” or multiracial). The 2020 Census National Redistricting Data Technical Documentation offers examples of detailed responses that are classified as SOR. The bolded groups in Table 1 are those with a relatively large presence in New York City. Notably, Guyanese and Brazilian, two large non-Hispanic groups in New York City, are classified as SOR because their origins do not suggest a definitive racial identity. Figure 11 details acceptable and reclassified responses under the SOR category. Guyanese is an acceptable write-in response under the SOR category because OMB does not define it racially (Figure 11 (b)). Sometimes when respondents do not find their group listed under one of the major racial categories they write it in the SOR category.10 If OMB has already defined these groups racially the Census Bureau reclassifies the response, as in the case of Trinidadian (Figure 11 (c)), which is defined as a Black racial group.11
2.4 Two or More Races
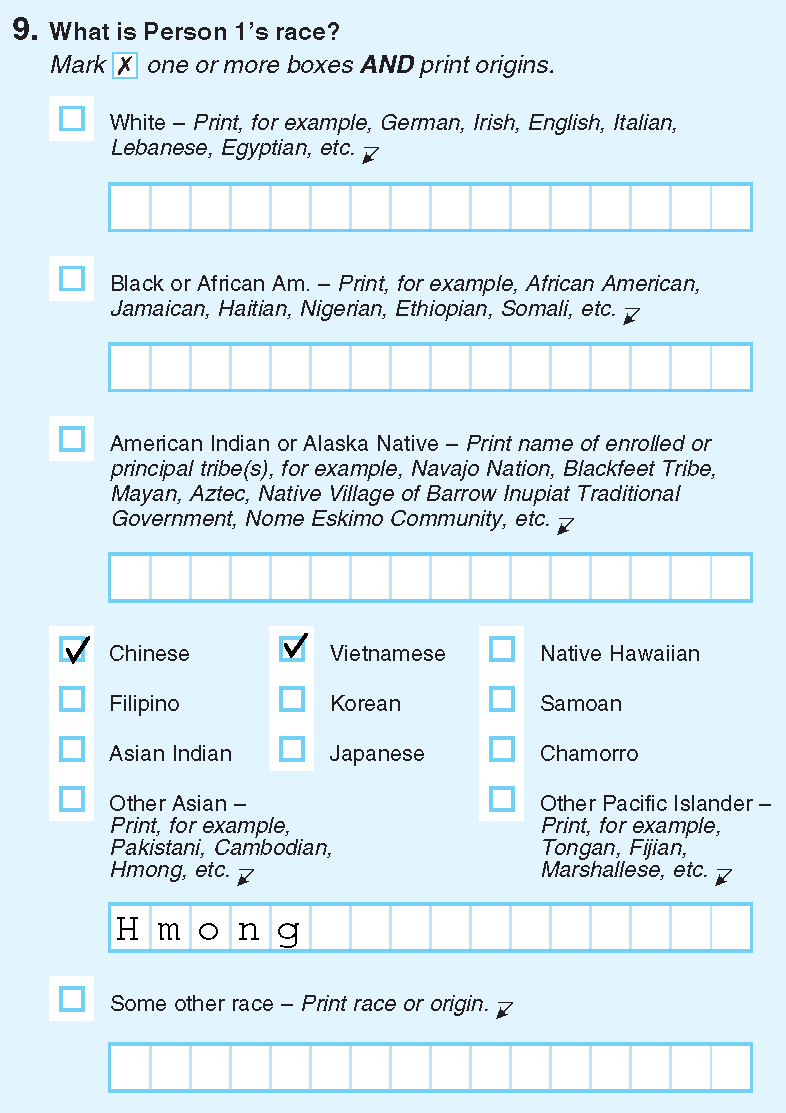
In 1997, OMB revised its standards for gathering and reporting data on race and ethnicity, including a directive to allow for the reporting of more than one race.12 Following OMB’s guidelines, respondents were given the option to check off more than one race on a census questionnaire for the first time in 2000, and those who did were then tabulated into a “two or more” races category. In the 2020 Census “two or more races” referred to the reporting of more than one of the six major race categories with 57 possible combinations (Figure 7). Respondents could check off two or more responses across categories (Figure 12 (a)) or write in an origin not listed as an example group (Figure 12 (b)).
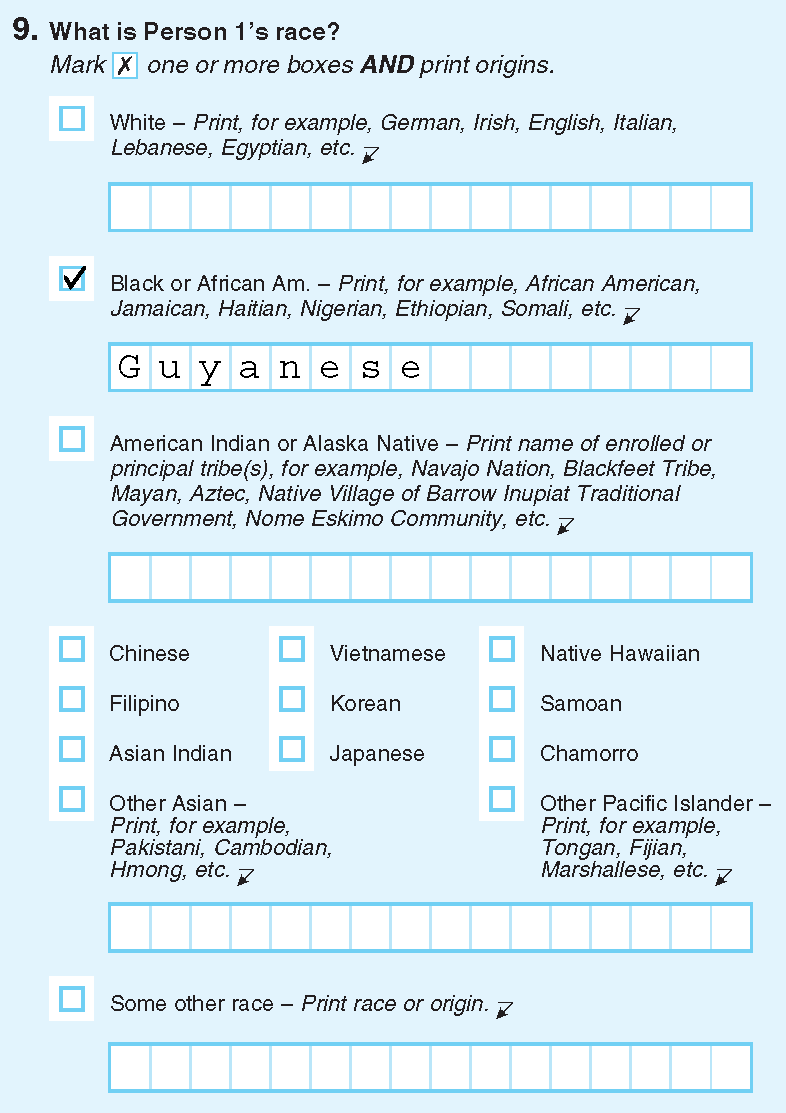
Changes to the 2020 Census race question resulted in unanticipated and, perhaps, unintended ways for respondents to be classified as two or more races. This is due to the stipulation that write-in response on origin must match the racial category’s definition. When the Census Bureau perceives a dissonance between the racial category the respondent checked and the origin entered in the category’s write-in area, it reassigns “mismatched” write-in responses to the category whose definition it best fits.13 For example, respondents who check the Black category and write in their origin as Guyanese are categorized as Black in combination with SOR because Guyanese is not a Black racial group according to OMB (Figure 6). Likewise, Brazilian written under the White category is tabulated as White and SOR because, like Guyanese, Brazilian does not indicate a definitive race group (see Section 2.3).
Questionnaire changes primarily affected the city’s Black and White populations, some of whom may have been counted as a single race in the previous decade but were identified as multiracial in 2020 due to writing in an origin that did not map into OMB’s racial schema. While the census is based on self-identification, the limitations set by OMB’s definitions of race and Hispanic origin create a constant negotiation between responses and their coding and tabulation into reliable and usable data. As a result, respondents could be assigned to categories in the final tabulation that they did not select and at odds with how they self-identify.

3 Contextualizing Change
3.1 Impact of Increase in Multiple-race Responses
New York City’s population grew by 8 percent between 2010 and 2020 (Table 2). Almost all groups increased during this period. Among the four largest groups, the Asian population grew the fastest (34 percent), the White population fell modestly, and the Black population declined by 5 percent. In contrast, the SOR alone and two or more races populations more than doubled.
| 2010 | 2020 | Change | ||||
|---|---|---|---|---|---|---|
| Number | Percent | Number | Percent | Number | Percent | |
| New York City, Total | 8,175,133 | 100.0 | 8,804,190 | 100.0 | 629,057 | 7.7 |
| Hispanic | 2,336,076 | 28.6 | 2,490,350 | 28.3 | 154,274 | 6.6 |
| White NH | 2,722,904 | 33.3 | 2,719,856 | 30.9 | −3,048 | −0.1 |
| Black NH | 1,861,295 | 22.8 | 1,776,891 | 20.2 | −84,404 | −4.5 |
| Asian NH | 1,028,119 | 12.6 | 1,373,502 | 15.6 | 345,383 | 33.6 |
| Some other race NH | 57,841 | 0.7 | 121,184 | 1.4 | 63,343 | 109.5 |
| American Indian & Alaska Native NH | 17,427 | 0.2 | 19,146 | 0.2 | 1,719 | 9.9 |
| Native Hawaiian & Other Pacific Islander NH | 2,795 | 0.0 | 3,302 | 0.0 | 507 | 18.1 |
| Two or more races | 148,676 | 1.8 | 299,959 | 3.4 | 151,283 | 101.8 |
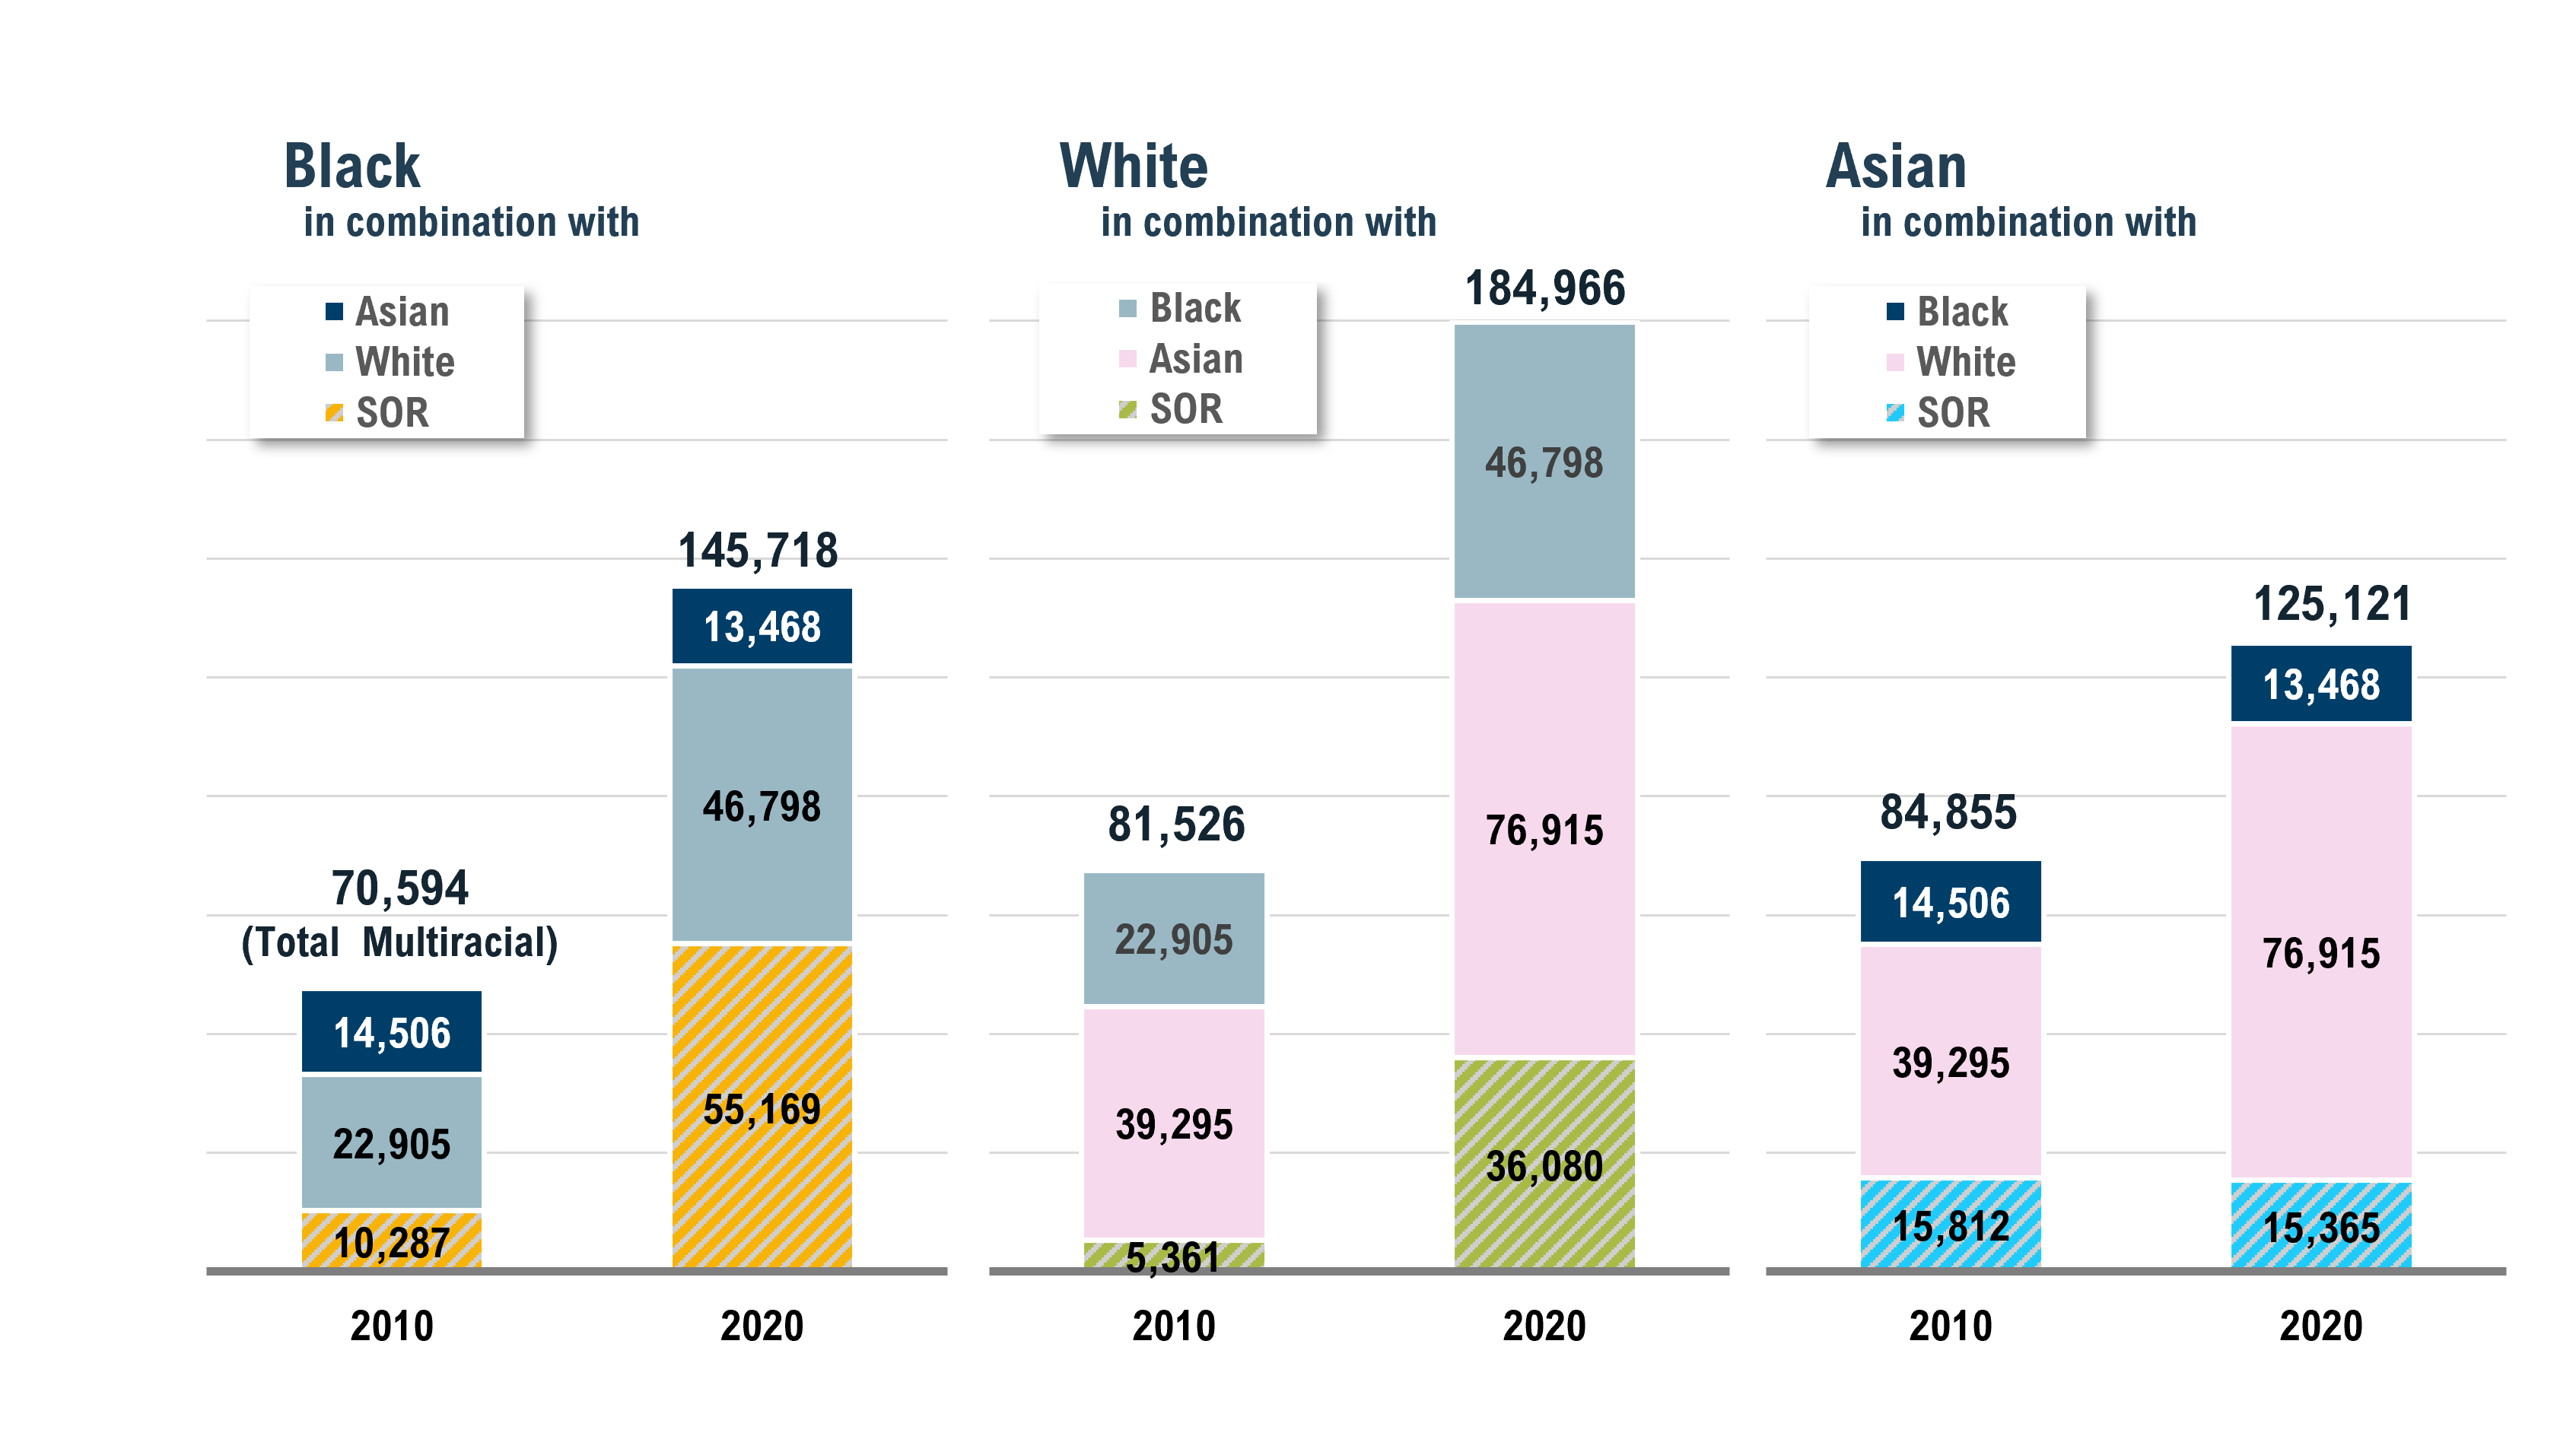
The multiracial population identifying as Black in combination with one or more other races more than doubled, from 70,600 in 2010 to 145,700 in 2020 (Figure 13). Nearly 60 percent of the growth in this population was a result of those who identified as Black and SOR, who grew from 10,300 to 55,200, a five-fold or 45,000 increase. The potential misclassification of 45,000 Black respondents could have accounted for as much as one-half of the decline in the Black population. The multiracial population identifying as White in combination with one or more other races also saw high growth, more than doubling from 81,500 to 188,000, with the increase in the White and SOR population accounting for just over one-quarter of this increase. Indeed, changes to the questionnaire very likely affected the Black population and, to a lesser extent, the White population, disproportionately. Taken together these results suggest that some Black, as well as White respondents, who may have been counted as a single race in the previous decade had their origins treated as a separate race, rather than an inclusive component of their identity, and were identified as multiracial.
While the above increases in the multiracial population may have been misleading, other changes reflected a real demographic shift in the number of respondents identifying as being of two or more races. The multiracial population that was Black and White more than doubled in size, from 22,900 in 2010 to 46,800 in 2020, and the multiracial population identifying as White and Asian nearly doubled to 76,900.
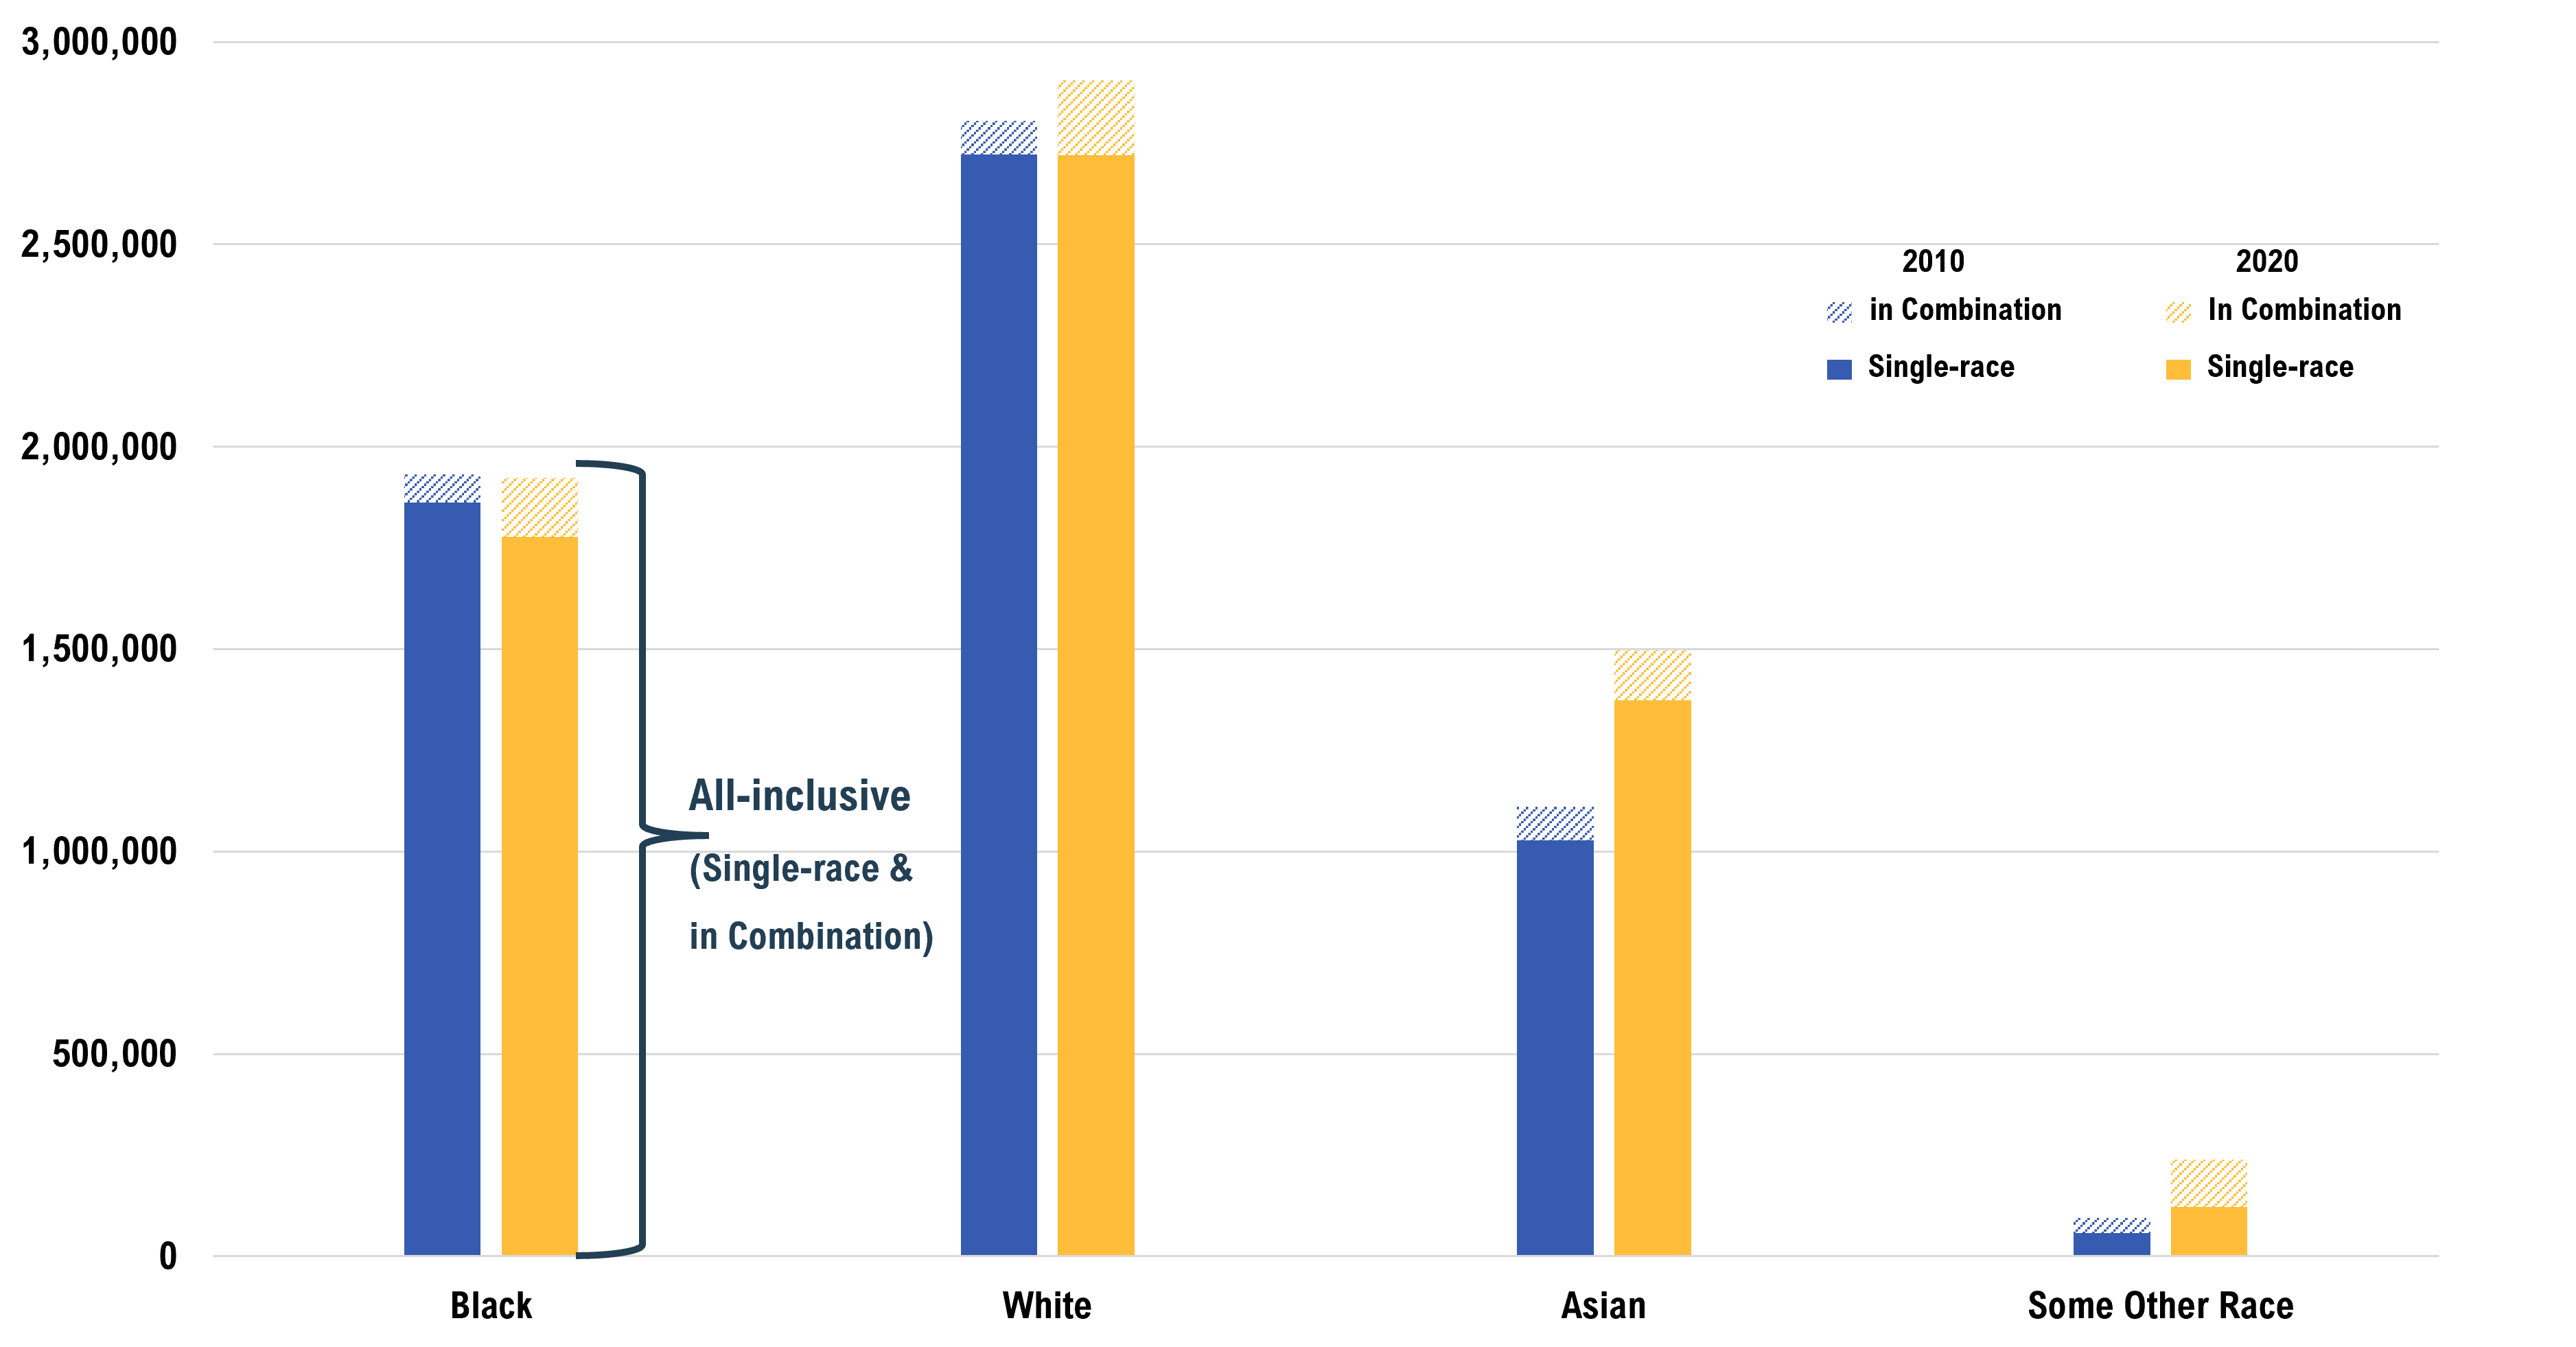
In order to examine the impact of the large increase in the multiracial population on single-race groups, we combine multiple race responses back to their constituent single-race groups, creating an “all-inclusive total” for race groups.14 This means a multiracial respondent who identified as being Black and White was counted in both an all-inclusive Black total and an all-inclusive White total. This approach of counting individuals in every category they selected better reflects the simultaneity of racial identity.
Figure 14 shows the impact of an all-inclusive total on the overall count of each race group: The decline of 3,000 in the White single-race population contrasts with an increase of 100,400 in an all-inclusive White total; the 84,400 decline in the Black single-race population is attenuated to a decrease of just 9,300; and the Asian population increase of 345,400 is augmented to 385,600.
4 Summary
The declines in New York City’s Black and White populations in the last decade need to be viewed in the context of the growth in its multiracial population, which doubled. Some of the increase in the multiracial population was an artifact of a change in the census questionnaire, which especially affected Black, and to a lesser extent, White respondents who may have been counted as a single race based on the 2010 questionnaire, but were identified as multiracial by the updated 2020 format. This misclassification could have accounted for as much as one-half of the decline in the Black population and highlights the methodological challenges that emerge when respondents’ ethnic origins do not align with OMB’s definition of their race. But the increase in the multiracial population also reflected a real demographic shift in the number of respondents identifying as being of two or more races. The multiracial population identifying as Black and White grew from 22,900 in 2010 to 46,800 in 2020, and the multiracial population identifying as White and Asian saw a near two-fold increase, to 76,900. When the increase in the multiracial population is taken into account, the 84,400 decline in the Black population is attenuated to a decrease of just 9,300, while the decline of 3,000 in the White population turns into an increase of over 100,000. By accounting for the overlap in how individuals self-identify, this monograph gives a more complete picture in changes in the city’s Black and White populations.
Download
Acknowledgements
NYC Department of City Planning
Executive Office
Daniel R. Garodnick, Director
Edith Hsu-Chen, Executive Director
Strategic Planning
Laura Smith, Deputy Executive Director
Population Division
Joel Alvarez, Director
Arun Peter Lobo, Chief Demographer
Donnise Hurley, Senior Geographic Analyst (Lead)
Charles Christonikos
Eric Ketcham
Erica Maurer
Stephen Wolkwitz
Footnotes
The major ethno-racial groups discussed in this monograph are mutually exclusive and include the categories “White non-Hispanic, alone,” “Black or African American non-Hispanic, alone,” “Asian non-Hispanic, alone,” “Some Other race non-Hispanic, alone,” and “Two or More races non-Hispanic.” For the sake of succinctness, these groups are referred to as “White,” “Black,” “Asian,” “Some other race/SOR,” and “two or more/multiracial.”↩︎
For example, Blow, C. M. (2021, Aug 22) Opinion | Chocolate Chip Cities. The New York Times.; Gonen, Y.; Michel, C., & Welch, W. (2021, Aug 12). New York City’s Population Booms—But Not for Everyone, Everywhere. The City.; and Sundaram, A. (2023, Feb 3). The African American exodus from New York City. Gothamist.↩︎
Office of Management and Budget. Race and ethnic standards for federal statistics and administrative reporting. Statistical Policy Directive 15. 1977.↩︎
Office of Management and Budget. Revisions to the standards for the classification of federal data on race and ethnicity. 1997.↩︎
U.S. Census Bureau. (2021). 2020 Census National Redistricting Data (Public Law 94-171) Technical Documentation↩︎
Office of Management and Budget. Revisions to the standards for the classification of federal data on race and ethnicity. 1997↩︎
U.S. Census Bureau. (2021). 2020 Census National Redistricting Data (Public Law 94-171) Technical Documentation↩︎
Swarns, R.L. (2004, Nov 23). National Briefing | Washington: ‘Other Race’ Stays on The Books. The New York Times.↩︎
Compton, E., Bentley, M., Ennis, S., & Rastogi, S. (2012). 2010 census race and Hispanic origin alternative questionnaire experiment. Decennial Statistical Studies Division; Population Division, U.S. Census Bureau.↩︎
U.S. Census Bureau. (2021). 2020 Census National Redistricting Data (Public Law 94-171) Technical Documentation↩︎
Office of Management and Budget. Revisions to the standards for the classification of federal data on race and ethnicity. 1997.↩︎
2020 Census National Redistricting Data Technical Documentation↩︎
The “all-inclusive” totals for single non-Hispanic race groups are more than the total population because each response can be included in more than one race category.↩︎